
Page 25 - General Election
P. 25
Total
Total Number of
Total number Total Number Total number of Polling
Year of seats of Candidates Electorate Votes Polled Stations
1952 489* 1874 1,73,212,343 - 1,96,084
1957 494* 1519 1,93,652,179 1,20,513,915 2,20,478
1962 494 1985 2,16,361,569 1,19,904,284 2,38,031
1967 520 2369 2,50,207,401 1,52,724,611 2,43,693
1971 518 2784 2,74,189,132 1,51,536,802 3,42,918
1977 542 2439 3,21,174,327 1,94,263,915 3,73,910
1980 529/542** 4629 3,56,205,329 2,02,752,893 4,36,813
1984-85 541/542*** 5492 4,00,375,333 2,56,294,963 5,06,058
1989 529/543**** 6160 4,98,906,129 3,09,050,495 5,80,798
1991-92 534/543***** 8749 5,11,533,598 2,85,856,465 5,91,020
1996 543 13952 5,92,572,288 3,43,308,090 7,67,462
1998 543 4750 6,05,880,192 3,75,441,739 7,73,494
1999 543 4648 6,19,536,947 3,71,669,104 7,74,651
2004 543 5435 6,71,487,930 3,89,948,330 6,87,402
2009 543 8070 71,69,85,101 41,72,36,311 8,30,866
2014 543 8251 83,40,82,814 55,41,75,255 9,27,553
2019 543 8054 91,19,50,734 614172823 10,37,848
* Upto 1957 election, certain constituencies were representing 02 or 03 seats.
th
** In General Elections 1980 (7 Lok Sabha) the Elections on 12 seats of Assam & 01 seat of Meghalaya were not
held along with whole country.
th
*** In General Elections, 1984 (8 Lok Sabha) the Elections on 14 seats of Assam & 13 seats of Punjab were held
in 1985.
th
**** In General Elections ,1989 (9 Lok Sabha) the Elections on 14 seats of Assam were not held.
th
***** In General Elections 1991 (10 Lok Sabha) the Elections on 13 seats of Punjab & 6 seats of Jammu &
Kashmir were not held.
th
***** In General Elections 1991 (10 Lok Sabha) the Elections on 2 seats of Bihar & 1 seat of UP were not
completed.
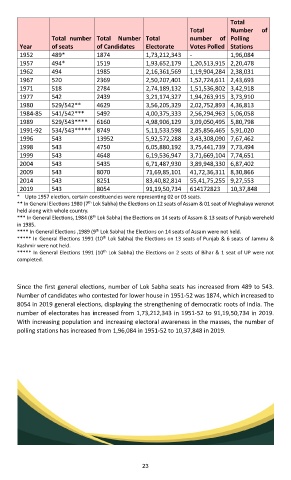
Since the first general elections, number of Lok Sabha seats has increased from 489 to 543.
Number of candidates who contested for lower house in 1951-52 was 1874, which increased to
8054 in 2019 general elections, displaying the strengthening of democratic roots of India. The
number of electorates has increased from 1,73,212,343 in 1951-52 to 91,19,50,734 in 2019.
With increasing population and increasing electoral awareness in the masses, the number of
polling stations has increased from 1,96,084 in 1951-52 to 10,37,848 in 2019.
23